Confidence Intervals
Choose Stats > Confidence Intervals.
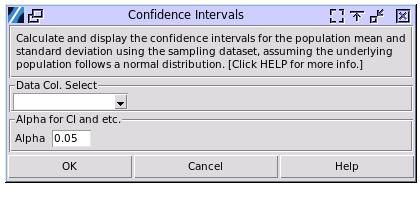
Data Col. Select: Choose the column containing your sampled dataset. The population from which the sample was drawn should be normally distributed.
Alpha: Specify the alpha level for the confidence intervals. An alpha of 0.05 corresponds to a 95% confidence interval for the population mean and standard deviation, while an alpha of 0.1 corresponds to a 90% confidence interval, and so on.
A sample output:
---- Confidence Intervals ----
For the population where the samples came from:

95.0% Prob that mean is in the range of (0.520, 1.469)
95.0% Prob that mean is less than 1.386.
95.0% Prob that mean is greater than 0.602.

95.0% Prob that SD is in the range of (0.771, 1.480)
95.0% Prob that SD is less than 1.389.
95.0% Prob that SD is greater than 0.805.
SD CI method is same to JMP but different from Minitab.
Interpretation:
Two-sided Confidence Interval: A 95% two-sided confidence interval with bounds of (-0.119, 0.852) for a population mean can be interpreted as: “We are 95% confident that the true population mean falls between -0.119 and 0.852.” This means that if we were to repeat the sampling process many times and calculate the confidence interval each time, about 95% of these intervals would contain the true population mean.
One-sided Confidence Interval: A 95% one-sided upper bound of 0.767 can be interpreted as: “We are 95% confident that the true population mean is less than or equal to 0.767.” Similarly, a 95% one-sided lower bound of -0.035 can be interpreted as: “We are 95% confident that the true population mean is greater than or equal to -0.035.”
The interpretation of the confidence interval for the standard deviation is similar to that of the mean confidence interval described above.